



Contents
Ampere vs Ada vs Blackwell
Compare three generations of NVIDIA professional GPUs in one place. Ampere launched in 2021, Ada Lovelace followed in 2022, and Blackwell is available today. Across these generations, the biggest advances include PCIe connectivity, memory bandwidth, Tensor cores and rendering performance, helping professionals tackle increasingly demanding workloads.
Ampere
Launched 2021
Ada Lovelace
Launched 2022
Blackwell
Launched 2025
Process
Samsung 8 nm
TSMC 4N
TSMC 4NP
PCIe
Gen 4.0
Gen 4.0
Gen 5.0
Memory
GDDR6 + ECC
GDDR6 + ECC
GDDR7 + ECC
Tensor cores
3rd gen
4th gen
5th gen
RT cores
2nd gen
3rd gen
4th gen
Flagship VRAM
48 GB
48 GB
96 GB
Peak bandwidth
768 GB/s
960 GB/s
1,792 GB/s
Compare every NVIDIA Professional GPU
Explore every current GPU across the Ampere, Ada and Blackwell generations, from entry-level low-profile models through to flagship cards. In addition, the Blackwell flagship is available in three cooling variants—Workstation, Max-Q and Server—all featuring the same underlying GPU architecture but optimised for different deployment environments.
| CUDA Cores | RT Cores | VRAM | Bandwidth | NVENC | TDP | Form Factor | |
|---|---|---|---|---|---|---|---|
| Flagship | |||||||
| RTX A6000 | 10,752 | 84 | 48 GB | 768 GB/s | 1x | 300 W | Dual-slot |
| RTX 6000 Ada | 18,176 | 142 | 48 GB | 960 GB/s | 2x | 250 W | Dual-slot |
| RTX PRO 6000 Blackwell Workstation | 24,064 | 188 | 96 GB | 1,792 GB/s | 3x | 600 W | Dual-slot open-air |
| RTX PRO 6000 Blackwell Max-Q | 24,064 | 188 | 96 GB | 1,792 GB/s | 3x | 300 W | Dual-slot blower |
| RTX PRO 6000 Blackwell Server | 24,064 | 188 | 96 GB | 1,792 GB/s | 3x | 600 W | Passive |
| Upper-Mid | |||||||
| RTX A5000 | 8,192 | 64 | 24 GB | 768 GB/s | 1x | 230 W | Dual-slot |
| RTX 5000 Ada | 12,800 | 100 | 32 GB | 576 GB/s | 2x | 250 W | Dual-slot |
| RTX PRO 5000 Blackwell | 14,080 | 110 | 48 GB | 1,344 GB/s | 2x | 300 W | Dual-slot |
| Mid | |||||||
| RTX A4000 | 6,144 | 48 | 16 GB | 488 GB/s | 1x | 140 W | Single-slot |
| RTX 4000 Ada | 6,144 | 48 | 20 GB | 360 GB/s | 1x | 130 W | Single-slot |
| RTX PRO 4000 Blackwell | 8,960 | 70 | 24 GB | 672 GB/s | 1x | 140 W | Single-slot |
| RTX PRO 4000 Blackwell SFF | 8,960 | 70 | 24 GB | 432 GB/s | 1x | 70 W | LP dual-slot |
| Entry Pro | |||||||
| RTX A2000 | 3,328 | 26 | 12 GB | 288 GB/s | 1x | 70 W | LP dual-slot |
| RTX 2000 Ada | 2,816 | 22 | 16 GB | 224 GB/s | 1x | 70 W | LP dual-slot |
| RTX PRO 2000 Blackwell | 4,608 | 36 | 16 GB | 320 GB/s | 1x | 70 W | LP dual-slot |
| Low Profile | |||||||
| RTX A1000 | 2,304 | 18 | 8 GB | 192 GB/s | 1x | 50 W | LP single-slot |
| RTX 2000E Ada | 2,816 | 22 | 16 GB | 224 GB/s | 1x | 50 W | LP single-slot |
| RTX PRO 2000 Blackwell SFF | 3,584 | 28 | 12 GB | 320 GB/s | 1x | 70 W | LP single-slot |
How different workloads use your GPU
Flagship – Blender GPU Render Throughput – A6000 = 1.00x
RTX A6000
Ampere · 2021
1.00x
RTX 6000 Ada
Ada · 2022
~2x
RTX PRO 6000 Blackwell
Blackwell · 2025
~3x
Mid Tier – Blender GPU Render Throughput – RTX 4000 Ada = 1.00x
RTX A4000
Ampere · 2021
~0.97x
RTX 4000 Ada
Ada · 2022
1.00x
RTX PRO 4000 Blackwell
Blackwell · 140 W single-slot
+40%
Source: Puget Systems 2025 professional GPU testing. The RTX PRO 6000 Blackwell Max-Q at a matched 300 W TDP
beats the RTX 6000 Ada by 30–50%, same power envelope, one architecture ahead.
Rendering performance comparison
Blender GPU rendering provides one of the clearest ways to compare performance across GPU generations. At the flagship level, three generations of architectural improvements deliver up to three times the rendering performance. Likewise, at the mid-range, Blackwell provides around a 40% improvement over Ada while maintaining the same power envelope and form factor.
AI Performance across GPU generations
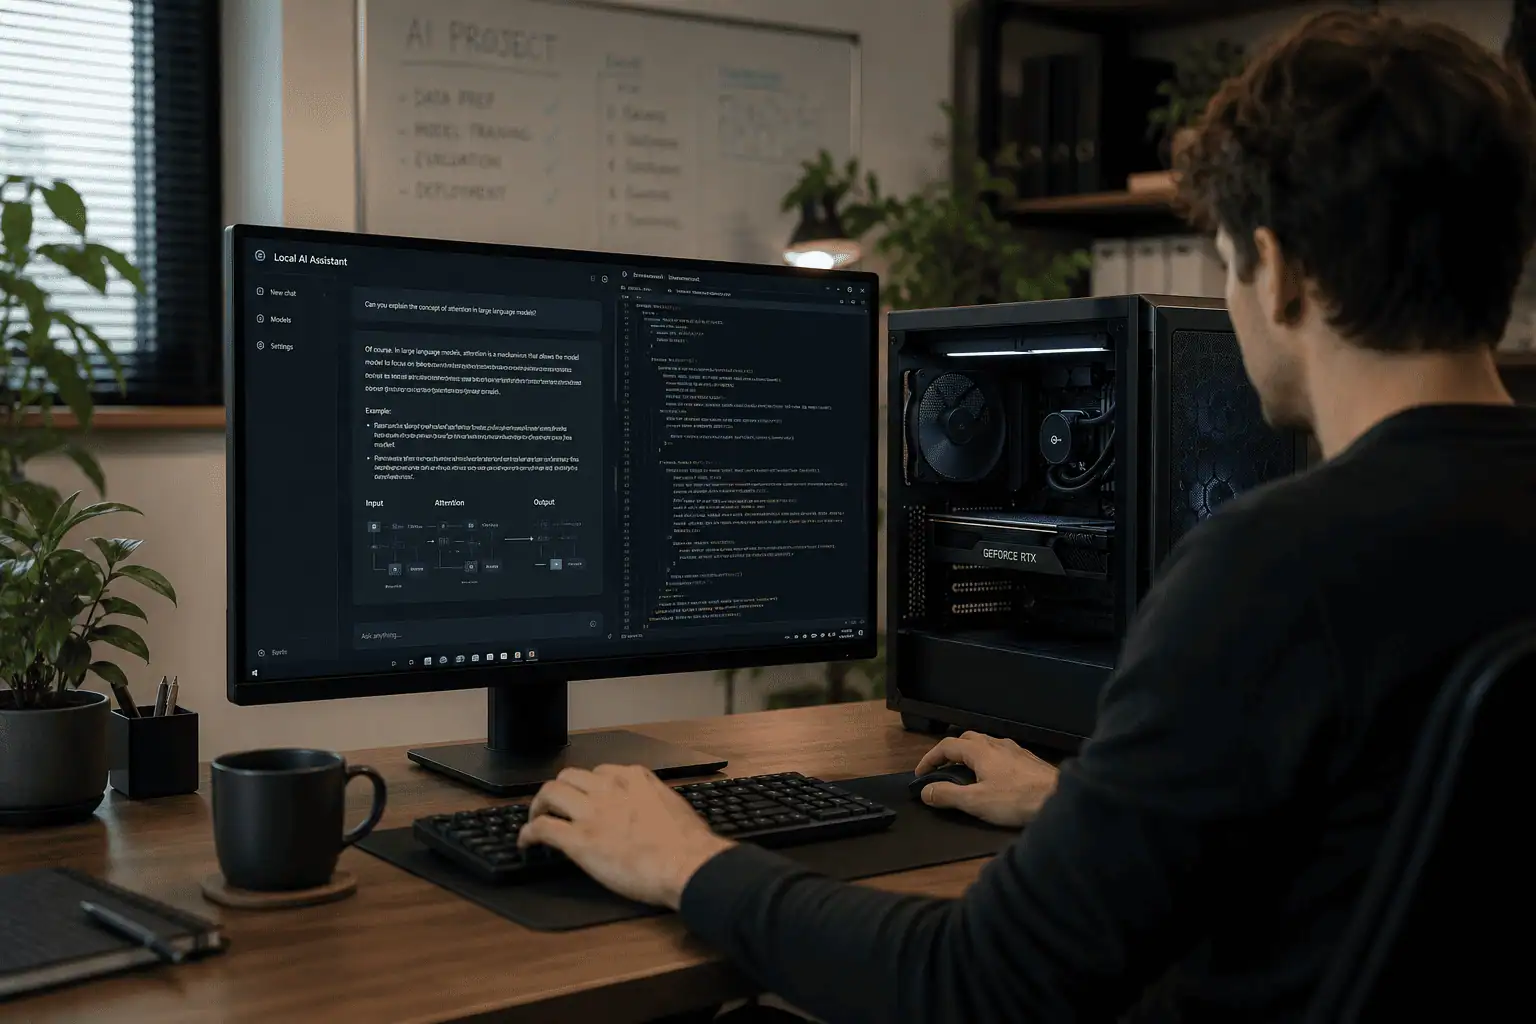
For local AI inference, performance depends on three key factors: the model must first fit into VRAM, memory bandwidth determines how quickly data can be processed, and Tensor core throughput sets the theoretical performance ceiling. As a result, Blackwell delivers improvements across each of these areas, making it well suited to modern AI workloads.
Flagship – Memory Bandwidth GB/s
RTX A6000
Ampere · 2021
768
RTX 6000 Ada
Ada · 2022
960
RTX PRO 6000 Blackwell
Blackwell · 2025
1792
Flagship – Inference Throughput – A6000 FP16/INT8 = 1.00x
RTX A6000
FP16/INT8
1.00x
RTX 6000 Ada
+ FP8
~2x
RTX PRO 6000 Blackwell
+ FP4
up to ~5x
Video encoding comparison: Ampere vs Ada vs Blackwell
| Capability | Ampere | Ada Lovelace | Blackwell |
| NVENC generation | 7th gen | 8th gen | 9th gen |
| NVDEC generation | 5th gen | 5th gen | 6th gen |
| AV1 encode | No | Yes | Yes – UHQ |
| 4:2:2 10-bit hardware decode | No | No | No |
| NVENC engines, flagship | 1x | 2x | 3x |
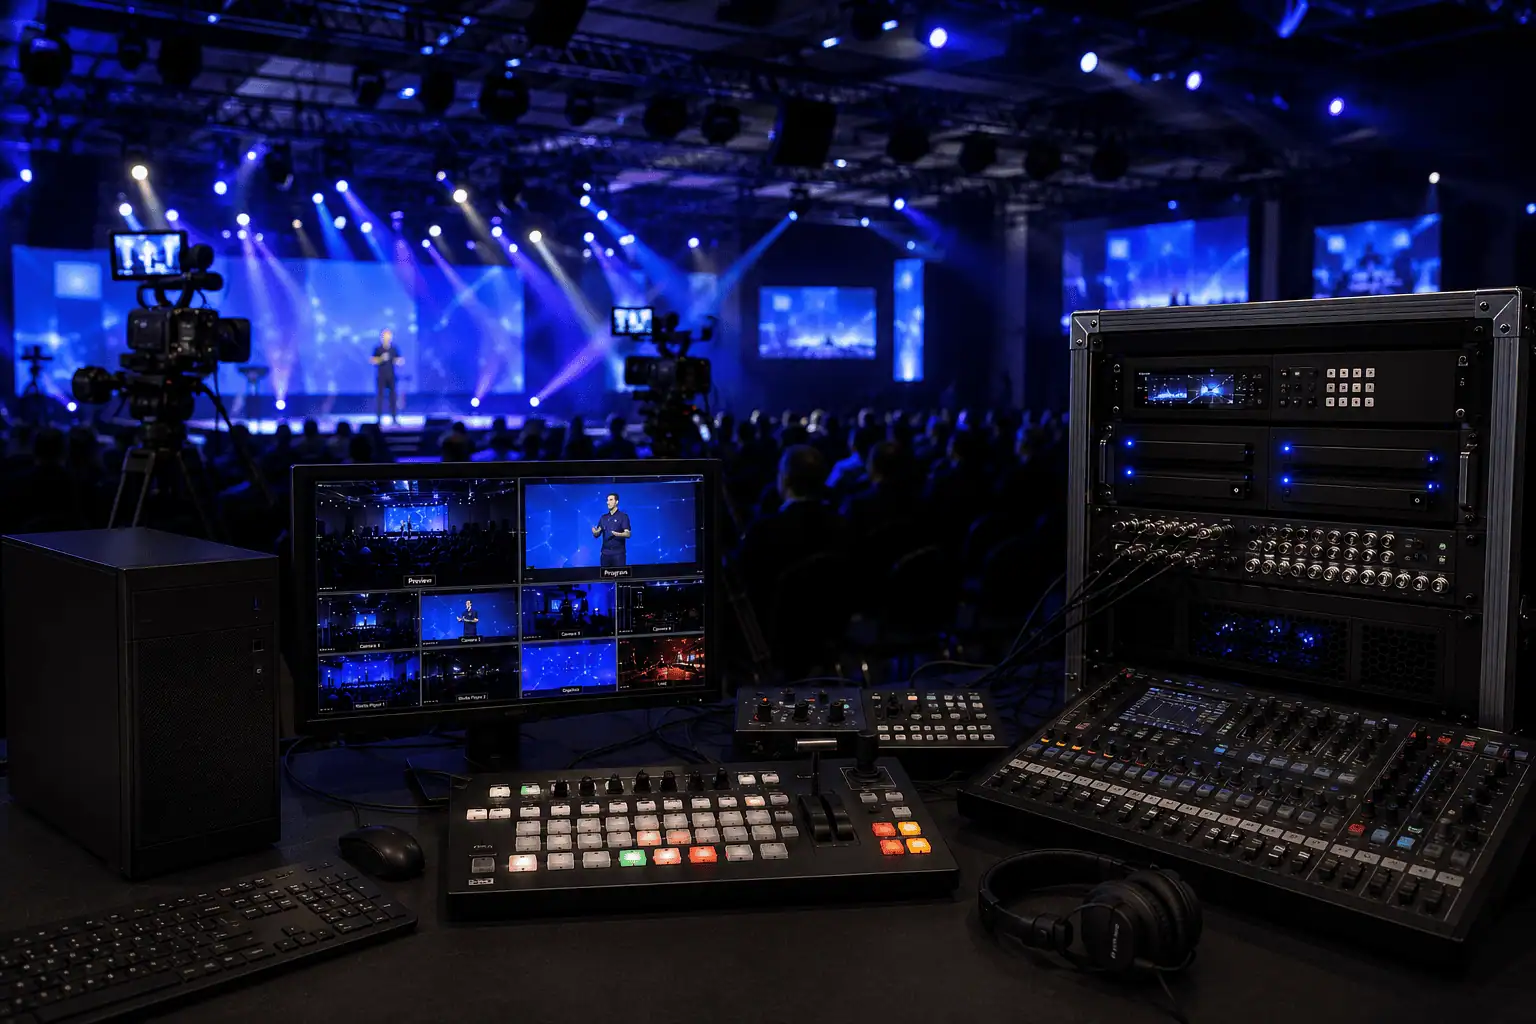
For multi-channel ingest, playout, and transcode, the relevant silicon is NVENC and NVDEC — not CUDA cores. Engine count sets the channel ceiling. Format support determines whether the pipeline runs in hardware or falls back to CPU.
4:2:2 10-bit is the chroma format broadcast cameras, ProRes, and most professional codecs record in. On Ampere and Ada that decode work falls to the CPU — on Blackwell it runs in dedicated silicon. AV1 encode roughly halves the bitrate of H.264 at equivalent quality, which matters as soon as streams leave the building. Three NVENC engines on the PRO 6000 Blackwell lets one card replace what previously needed a row of transcode hardware.
Which Blackwell GPU should you upgrade to?
Because each new GPU generation pushes performance further up the product stack, replacing an Ampere card with its direct successor often results in more performance than many users actually need. Instead, the best Blackwell upgrade is frequently one tier below the equivalent Ampere model, delivering similar or greater performance while improving efficiency, memory bandwidth and overall value.
| RTX A6000 Ampere flagship – 300 W – 48GB – 768 GB/s – Dual-slot If you only need to match performance and stay within 300 W, step down one tier. | →RTX PRO 5000 Blackwell Upper-mid – 300 W – 48 GB – 1,344 GB/s – Dual-slot Same slot, same power, more cores and +75% bandwidth. Step up to the PRO 6000 only if 96 GB VRAM or maximum render throughput is required. |
| RTX A5000 Upper-mid – 230 W – 24 GB – 768 GB/s – Dual-slot | →RTX PRO 4000 Blackwell Mid – 140 W – 24 GB – 672 GB/s – Single-slot Matches on cores and VRAM, drops from 230 W to 140 W, and moves from dual- to single-slot. |
| RTX A4000 Mid – 140 W – 16 GB – 448 GB/s – Single-slot | →RTX PRO 4000 Blackwell Mid – 140 W – 24 GB – 672 GB/s – Single-slot Same power envelope, same form factor, more cores, +8 GB, +50% bandwidth. |
| RTX A2000 Entry pro – 70 W – 12 GB – 288 GB/s – LP dual-slot | →RTX PRO 2000 Blackwell Entry pro – 70 W – 16 GB – 320 GB/s – LP dual-slot Identical power and slot. More cores, +4 GB, AV1 encode and 4:2:2 decode added. |
RTX PRO 6000 Blackwell: Workstation vs Max-Q vs Server
The three RTX PRO 6000 Blackwell editions — Workstation, Max-Q, and Server — run identical silicon: 24,064 CUDA cores, 96 GB GDDR7, 1,792 GB/s. They differ only in power envelope and cooling.
The Max-Q caps at 300 W — half the Workstation Edition — and gives up approximately 10–12% in mixed creative workloads. That is close to 1.8× the performance-per-watt. For builds running two to four GPUs on a single PSU, the Max-Q is the variant that makes the density possible. The Server Edition is passively cooled and depends on chassis airflow for rack deployment.
Source: Puget Systems Max-Q vs Workstation comparison, Jul 2025.
Performance VS. TDP
Workstation Edition
600 W – Open-air dual fan
Max Throughput
Max-Q
300W – Blower
-10 to -12%
Server Edition
Passive – Chassis airflow
Rack Deploy
 Need a quick answer right now? Chat with us live using the icon at the bottom right of your screen
Share:


